


Conducting cost-effectiveness analysis (CEA)
Summary
This resource is intended for researchers who are interested in collecting cost data and conducting comparative cost-effectiveness analysis (CEA) for their evaluation. It provides an overview of CEA, outlines the basic calculations and key assumptions, and provides two comparative CEA examples from education. We link to guidance notes, cost collection templates, and a J-PAL guide on how to do CEAs, in particular the key decisions and assumptions needed for this analysis.
Introduction
Calculating the cost-effectiveness of a program—for instance, dollars spent per additional day of student attendance at school—can offer insights into which programs are likely to provide the greatest value for money in given situations. Cost-effectiveness analysis (CEA) summarizes complex programs in terms of a simple ratio of costs to impacts and allows us to use this common measure to compare different programs evaluated in different countries in different years.
CEA may not, by itself, provide sufficient information to inform all policy or investment decisions, but it can be a useful starting point for governments, donors, program implementers, and researchers when choosing between different programs that aim to achieve the same outcome. When the calculations are done at a highly disaggregated level, with assumptions about key factors such as program take-up or unit costs laid out explicitly, it is easier to gain insights into which programs are likely to provide the greatest value for money in a particular situation, and the key factors to which these outcomes are most sensitive.
To calculate CEA, you need two pieces of data: an estimate of the program’s impact and the cost of the program. While there are a growing number of rigorous impact evaluations from which to draw estimates of program effects, data on program cost is still scarce. In our experience, it is much easier and more accurate to collect cost information during the implementation of the program instead of trying to piece together the data after the evaluation is completed. However, gathering these data in real time is difficult. In order to help other organizations conduct this type of analysis, J-PAL has developed some resources to facilitate the collection of quality cost data:
- J-PAL Costing Guidelines: This document provides an outline on how to approach collecting cost information, what costs to include and exclude, and how detailed cost data should be.
- J-PAL Costing Template: This template aims to help users generate an estimate of total program costs. It provides users with a comprehensive list of the many different cost categories or ingredients that may be included in a program. Then, within each category, the template prompts users to input the various details about cost data (unit cost, number of units, currency, year, etc.).
- Basic J-PAL Costing Template: It is not always possible to gather very detailed cost data. If this data is unavailable, this template helps users generate a rough estimate of total program cost by breaking costs out into the main, general categories or ingredients.
- Comparative Cost-Effectiveness Analysis to Inform Policy in Developing Countries: There are many decisions to make when conducting CEAs including what discount rate and exchange rate to use. J-PAL’s CEA document explains the choices made by J-PAL with illustrations of how different choices would impact the relative cost-effectiveness of student attendance programs.
If you have any questions about these resources or about CEA, please contact [email protected].
J-PAL has conducted a number of CEAs. Continue reading below for an explanation of how costs are calculated as well as analyses of programs aimed at improving student participation and programs aimed at improving student learning.
How are costs calculated?
The calculations include only the incremental cost of adding a new education program, under the assumption that many of the fixed costs of running a school system will be incurred even in the absence of the program in question. The analysis assumes that policymakers care not just about the costs incurred by their organization or government ministry, but also about costs imposed on beneficiaries and society as a whole. We therefore include the following costs, when relevant:
- Beneficiary time when a direct requirement of the program, e.g. time involved in traveling to and attending program meetings;
- Goods or services that were provided for free (in situations where free procurement would not necessarily be guaranteed if the program were replicated in a new context);
- The monetary value of both cash and in-kind transfers.
Below is a list of assumptions we make across all of the analyses. For more details on the assumptions, please see Dhaliwal et al. 2013.
- Inflation is calculated using GDP deflators;
- When calculating the average inflation from the base year to the year of analysis, we assume that program costs are incurred on the first day of each year;
- Costs are expressed in terms of 2011 USD, with local currencies exchanged using standard (not PPP) exchange rates;
- A ten percent discount rate is applied for costs incurred over multiple years in order to adjust for the choice a funder faces between incurring costs this year, or deferring expenditures to invest for a year and then incurring costs the next year.
When converting costs to dollars in the year of analysis, J-PAL applies a standard order of operations to address inflation, exchange rates, and present value:
- Local cost data is exchanged into US dollars using the exchange rate from the year the costs were incurred;
- These costs are deflated back to the real value in base year prices using the average annual US inflation rate;
- A ten percent discount rate is applied to take the present value for costs incurred after the first year;
- Finally, the average US inflation rate is used to inflate costs forward to the year of analysis.
This particular order of operations is not necessarily better than any other order. The important thing is to select and consistently apply an order of operations to all programs in an analysis.
Student participation
When we discuss the cost-effectiveness of programs (see pages 24–26 of the Roll Call bulletin), we report results in terms of “additional years of schooling per US$100 spent.” This metric is calculated by multiplying the average impact on participation per student by the total number of students who received the program. One additional year of schooling refers to one academic year and not twelve months of classroom instruction. The calculations for the chart can be found below. You can also download the full workbook of all calculations.
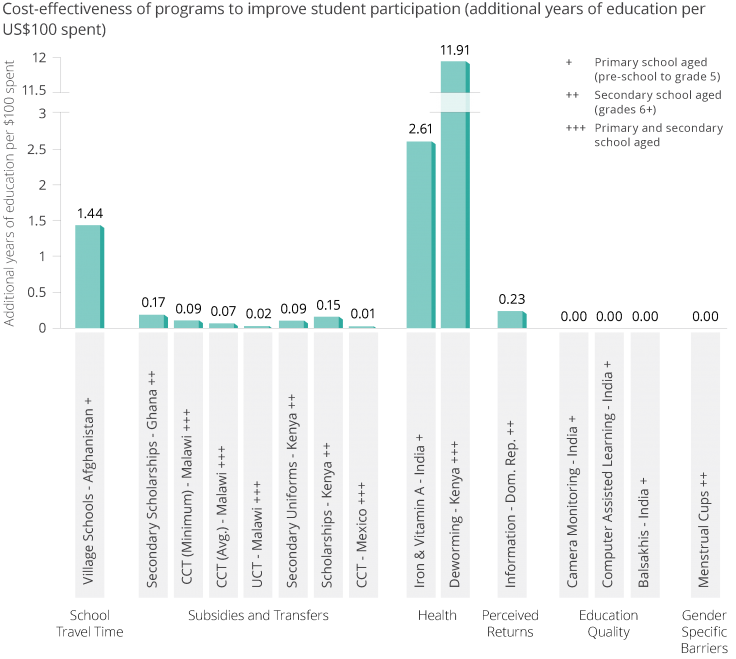
When interpreting cost-effectiveness, it is important to bear in mind that some programs, particularly conditional cash transfers, achieve other objectives than improving student participation. Programs will also tend to be more expensive in richer countries, not least because attendance rates tend to be higher to begin with. Additionally, it may be relatively harder to achieve impacts on participation in secondary school than in primary because older children typically have opportunities to earn higher wages outside of school.


Read our insights on student participation for more information.
Student learning
The numbers represent the total standard deviations (SD) gained across any sample size per US$100 spent. The cost-effectiveness of each program is measured as the ratio of the aggregate impact of the program—the average test score improvement per student multiplied by the number of students impacted—to the aggregate cost of implementing the program. Impacts are measured in terms of standard deviation changes in student test scores. Standard deviations measure how much individual test scores change because of a program compared to the average test score of the comparison group. For example, a 0.2 SD change would move a child from the 50th to the 58th percentile. In the education literature, an increase of less than 0.1 SD is typically considered a small effect, while an increase of more than 0.3 SD is considered a large effect, and an increase of more than 0.5 SD would be a very large effect.

The calculations for the above chart can be found below. You can also download the full workbook of all calculations. Read our insight on student learning for more information. All calculations are a work in progress and are subject to change. Please note that the associated paper for "Remedial Education, India 19" has a typesetting error on page 1263. The cost-effectiveness calculation indicates $0.67 per 0.1 standard deviations, not $0.67 per standard deviation. For any questions or comments, please contact [email protected].
Last updated July 2020.
These resources are a collaborative effort. If you notice a bug or have a suggestion for additional content, please fill out this form.
This research resource draws on a 2013 book chapter by Iqbal Dhaliwal, Esther Duflo, Rachel Glennerster, and Caitlin Tulloch, the J-PAL Roll call bulletin by Rachel Glennerster, Meghan Mahoney, Meagan Neal, Luke Strathmann, and Caitlin Tulloch, and a 2013 paper in Science by Michael Kremer, Conner Brennen, Rachel Glennerster, and Caitlin Tulloch. We would also like to thank Elizabeth Bond and Amanda Kohn for their contributions. All mistakes are our own.
Additional Resources
Unconditional cash transfers in Malawi (Baird, McIntosh, and Özler 2011)
Minimum conditional cash transfers in Malawi (Baird, McIntosh, and Özler 2011)
Girls' merit scholarships in Kenya (Kremer, Miguel, and Thornton 2009)
Village-based schools in Afghanistan (Burde and Linden 2012)
Reducing class size in Kenya (Duflo, Dupas, and Kremer 2015)
Building/improving libraries in India (Borkum, He, and Linden 2013)
School committee grants in the Gambia (Blimpo and Evans 2011)
Adding computers to classrooms in Colombia (Barrera-Osorio and Linden 2009)
Diagnostic feedback for teachers in India (Muralidharan and Sundararaman 2010)
Read-a-Thon in the Philippines (Abeberese, Kumler, and Linden 2007)
Individually-paced computer-assisted learning in India (Banerjee et al. 2007)
Extra contract teacher + streaming by achievement in Kenya (Duflo, Dupas, and Kremer 2011; 2012)
Teacher incentives in Kenya (Glewwe, Ilias, and Kremer 2010)
Camera monitoring and pay incentives in India (Duflo, Hanna, and Ryan 2012)
Training school committees in Indonesia (Pradhan et al. 2012)
Grants and training for school committees in the Gambia (Blimpo and Evans 2011)
School committee elections and linkage to local government in Indonesia (Pradhan et al. 2012)
Linking school committees to local government in Indonesia (Pradhan et al. 2012)